
TIR has previously provided a general summary of how to write scientific reports/papers, as well as more detailed and specific advice on writing Figure legends and Materials & Methods sections. Now we turn our attention to the real food & drink of any manuscript: the Results section.
As always, the following recommendations are not “the” way to go about it, but they definitely represent “a” way, and one that will hopefully be of help as you develop or refine your own style of science writing.
1. Have a rough outline of the paper ready.
There’s always a bit of a chicken-and-egg problem with papers, as all the elements are interdependent and so it can be difficult to judge what comes first. Do make sure though that you have a general sense of what your narrative arc is going to be – this gives you a rough sense of what data will feature, and in what order. It doesn’t need to be detailed, because it will inevitably change a bit as your story develops, but it’s important at the outset so you know where the Results fits in.
2. Make sure you’ve already finished the Figures and Figure legends.
Really important! This is the key trick to ensuring the Results section is written in a productive and painless way: get the Figures and the Figure legends completed first. With them finished, you’re already about 70% of the way through the whole workload and the Results becomes more of an easier downhill run.
If you’re unsure how to write Figure legends, see the short guide here. Results are actually quite easy to write because they’re basically expanded versions of the Figure legends with a bit less of the nuts & bolts detail and more coverage of the hypothesis, observations, and (some) interpretation. Don’t fool yourself that you’ll save time if you start writing the Results before the Figures are finished – you will just end up going in circles. And never, ever, ever write the Results before you have the Figures available – this will risk departures from what the data actually show and you’ll find yourself hunting around later for data that you think you have but probably don’t.
3. Break the Results up into sections.
Your Results will be composed of multiple sections, and each section = 1 figure (ideally). You can sometimes can have more than one section covered by a single figure (especially in these days of overloaded manuscripts), but always try to avoid single sections running to >1 figure. This is untidy, and it makes it harder for the reader to grasp what the main message from a particular figure is.
4. Each section is a mini-report.
Here’s the next rhetorical trick. You have your Figures, and each Figure will be covered by a section in your Results – now you write up each section as a mini-report. That means it contains:
(i) a headline/conclusion
This is the title of the section. What is the main message from the figure/section?
(ii) an aim/hypothesis (“[In order] to…”).
Why was the experiment done? Always present your Results as aim- or hypothesis-driven, as this is more compelling. Even though we tend to do research as more of a fishing expedition (“let’s see what happens if…”), in reality every experiment you do is testing a hypothesis of some kind. Make that explicit. A good example is screening for binding partners, almost the definition of a fishing expedition – when doing this we might think of it as “seeing what X binds to”, but it’s more compelling when it’s framed as “to identify candidate binding partners of X…”or “to test whether…”.
(iii) the method – what technique was used to carry out the aim or test the hypothesis.
There’s a bit of a judgement call here in terms of how much methodological detail to provide. Generally the Results have less technical detail than the Figure legends, which in turn have less than the Materials & Methods. But you do still need to communicate what the experimental setup was. If a reader can get the gist of what’s being shown in the figure without referring to the figure legend (which they will do when they want more a more precise description) then you’ve probably judged it right.
(iv) the results – what you observed.
Now you describe the observations you made using the method you described, and which you are sharing in your figure. Make sure that you cite panels in order, as a reader will become confused if you cite C before A, and so on. If you find that C has to come before A, change the figure so that that panel is now A. If your figure contains multiple techniques, you will need to go through several aim/method/results iterations – i.e., repeat steps (ii) to (v) – as you work your way through the panels.
(v) the overall conclusion/interpretation/conclusion.
Lastly, provide a short conclusion summarising what you observed and what was presented in this figure/section. It’s absolutely fine to include a bit of interpretation (“This suggested that…”) at this stage, especially so as to ensure that what follows in the next section is an intuitive extension from what you’ve shared here. No speculation though – that belongs in the Discussion.
Then repeat the whole process for the next section, and the next, until you’ve covered all the figures. And that’s it!
5. Use past tense and simple language.
Results are describing what was tested, what was done, what was observed, and so it all goes in the past tense. There are some exceptions – if you’re describing some component of the figure, that will be present tense. For example, “The cells were imaged and the degree of colocalisation was quantified by calculating the correlation coefficient [observation, past tense]. The data are shown as a dot plot and the median and standard deviation are indicated with bar and whiskers [description of figure components, present tense]”. Structural papers are often an exception too – it’s quite common to say that a structure was obtained (past tense) but then describe what the features of that structure are (present tense). Keep the language simple – many (most) of your readers will not be native English-speakers, so avoid flowery adjectives and complex sentences. Follow Hemingway’s advice and keep commas to a minimum.
6. Write in bullet points.
This is a really useful trick that will ensure you produce focused, succinct prose. In your first and subsequent drafts, write the sentences as bullet points (either literally, or simply by hitting the return key after each sentence). This lets you focus on the content of each sentence individually – when text is produced or presented as block paragraphs, the eye tends to start wandering and it gets harder to focus on the content and specificity of the individual sentences. Separating the sentences will let you hone each one and eliminate fluff. Don’t kid yourself that writing things out in block paragraphs in the first draft will save you time – in the long run, it will have the opposite effect as the text is harder to edit.
7. Maintain message discipline (the power of rhetoric).
Astute readers may have noticed already that there’s kind of a fractal pattern at work here. The Figure legends and the Results are recapitulating one another, but with slight differences of emphasis. The Figure legends describe single figures, and the Results are broken up into sections which each deal with a single figure. Each Figure legend is a kind of mini-report, and each Results section is a mini-report. Each mini-report (whether Figure legend or Results section) has a headline, an aim, a method, a result, and a conclusion. And of course the paper as a whole has its own title, aim, methods, results, conclusions.
Does this represent a kind of creative bankruptcy? Not a bit of it! This is rhetoric. The subtle repetition of the same points in the Figure legends and the Results helps build your case. By using a selective vocabulary and reiterating points, you will be able to encourage the reader to share your observations and conclusions of the data. Well-written papers will make you trust the authors and convince you that their conclusions are valid through this careful application of message discipline. This comes too from writing clearly, precisely, and using a simple, focused vocabulary.
8. Avoid stepping stone stories.
“Stepping stone” stories are a perversion of the hypothesis-driven approach. They will tend to have a structure along the lines of:
– propose a hypothesis.
– do an experiment, which “proves” the hypothesis (the experimental data always, always support the hypothesis).
– immediately propose the next hypothesis, which moves the story on a considerable distance.
– repeat.
In other words, experiments are done solely to support a priori conclusions and alternative interpretations of the data (or shortcomings in experimental design) are never considered. This is a very subtle and advanced form of pseudoscience, and should be avoided at all costs. Science is about designing experiments to tease out the workings of nature, not designing demonstrative displays that fit a preconceived narrative.
9. Check your supplementals really are supplemental.
A bigger and bigger problem. Many papers nowadays are too long and have too much data. This often means that important findings get pushed into the supplemental figures, where they don’t really belong. Supplemental figures are supposed to be for important but trivial results or tests – validation of reagents, control experiments, and so on. Ask yourself whether you could follow the paper and evaluate its conclusions without seeing any of the supplemental figures. If not, then they probably contain essential data that more properly belongs in the main figures.
10. Step back and make sure it ties together
Congratulations! You’re nearly there. Once you’ve finished all that, take a break, and then come back to the Results and go through everything line by line (the advantage of using bullet points!) to make sure it all ties together in a concise, compelling, and intelligible manner.
Lastly…
Get feedback! You need other eyes to look over the text to identify ambiguities, areas that could be misinterpreted, or parts that could be clearer. If one person highlights an issue, take note; if two people highlight the same issue, it definitely needs altering. Revise your text, and only afterwards when you’re satisfied that it’s ready for upload should you convert it to block paragraphs. Don’t forget to run a spellcheck and ideally get someone to proofread it. Only at this stage though – what’s important is that you get your scientific argument right; you don’t need to stress about the exactness of the English until the very end.
Some examples:
Here are some examples of really well-written Results sections. The first comes from JC Wang et al., 2022.
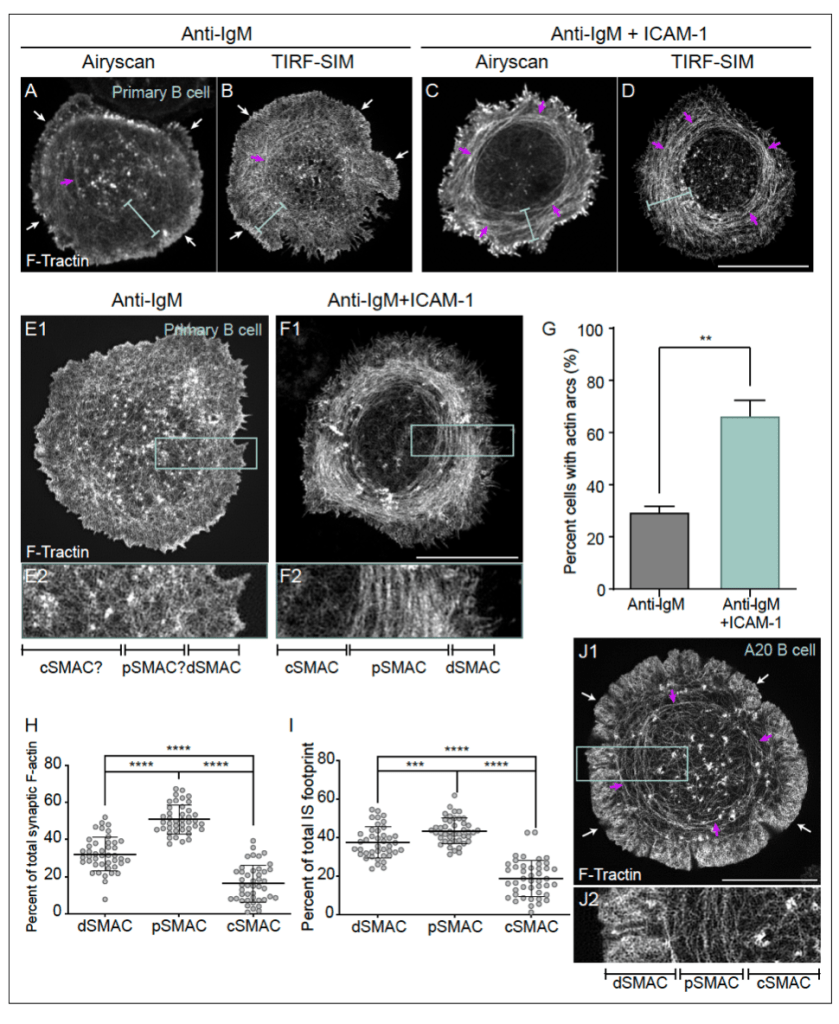

Note how the main message is neatly summarised in the section title, the aim is clearly defined at the start, there’s plenty of methodological description so that the reader is clear on what was done, followed by a concise description of the main observations. The conclusion/interpretation at the end subtly echoes the section title to reinforce the section’s main message.
And here’s a second example, from Hanna, Suen et al., 2022.
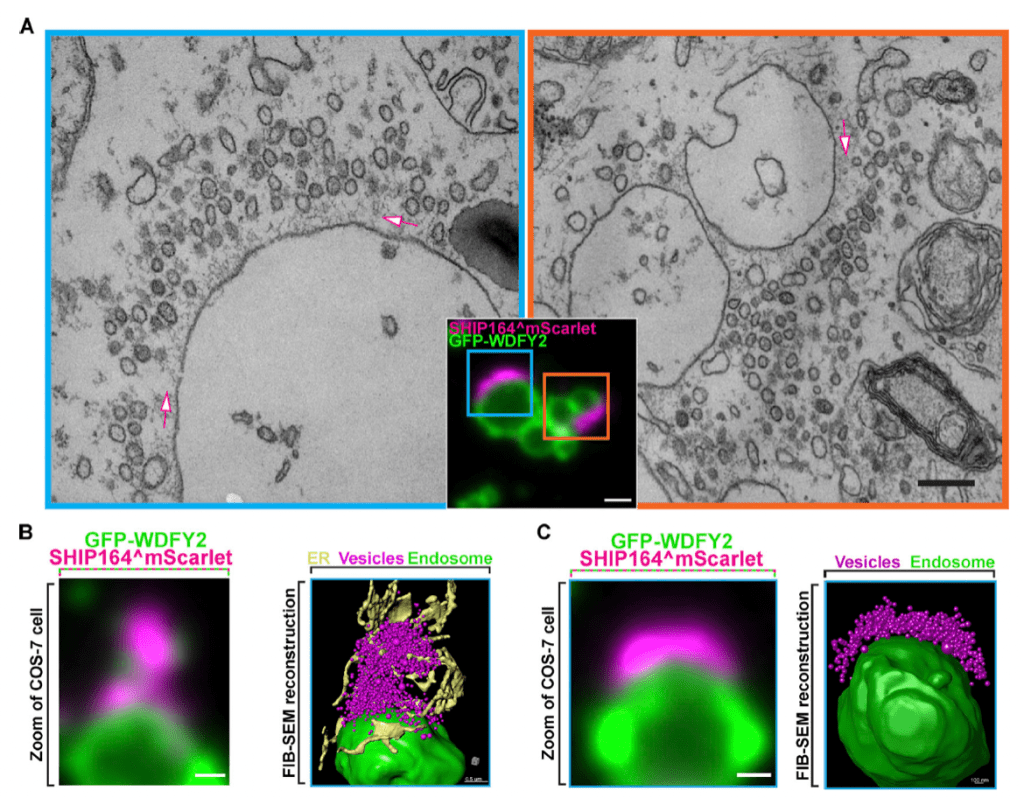

Again, the takehome message is very clear in the section title, the aim is succinctly defined at the start of the section, and the methods employed are detailed in depth. The main observations are clearly and briskly described, along with sources of uncertainty. The conclusion both summarises the main findings and points the way to the next set of experiments – examining SHIP164 at endogenous expression levels.
I hope that helps! As ever, comments/thoughts/feedback very welcome, and don’t forget that this is just a template – everyone has to develop their own style. If what you’ve written is clear and readily understandable, then you’ve done a good job.
Acknowledgements:
A big thanks to the senior authors (John A. Hammer, Karin M. Reinisch, Pietro De Camilli) of the featured papers for letting me deconstruct their work.

One thought on “The fruits of your labour (a short guide to writing Results sections)”